We were most interested in the creation and acquisition date of each piece.
We parsed the Creation Date and Accession Number fields to get the data:
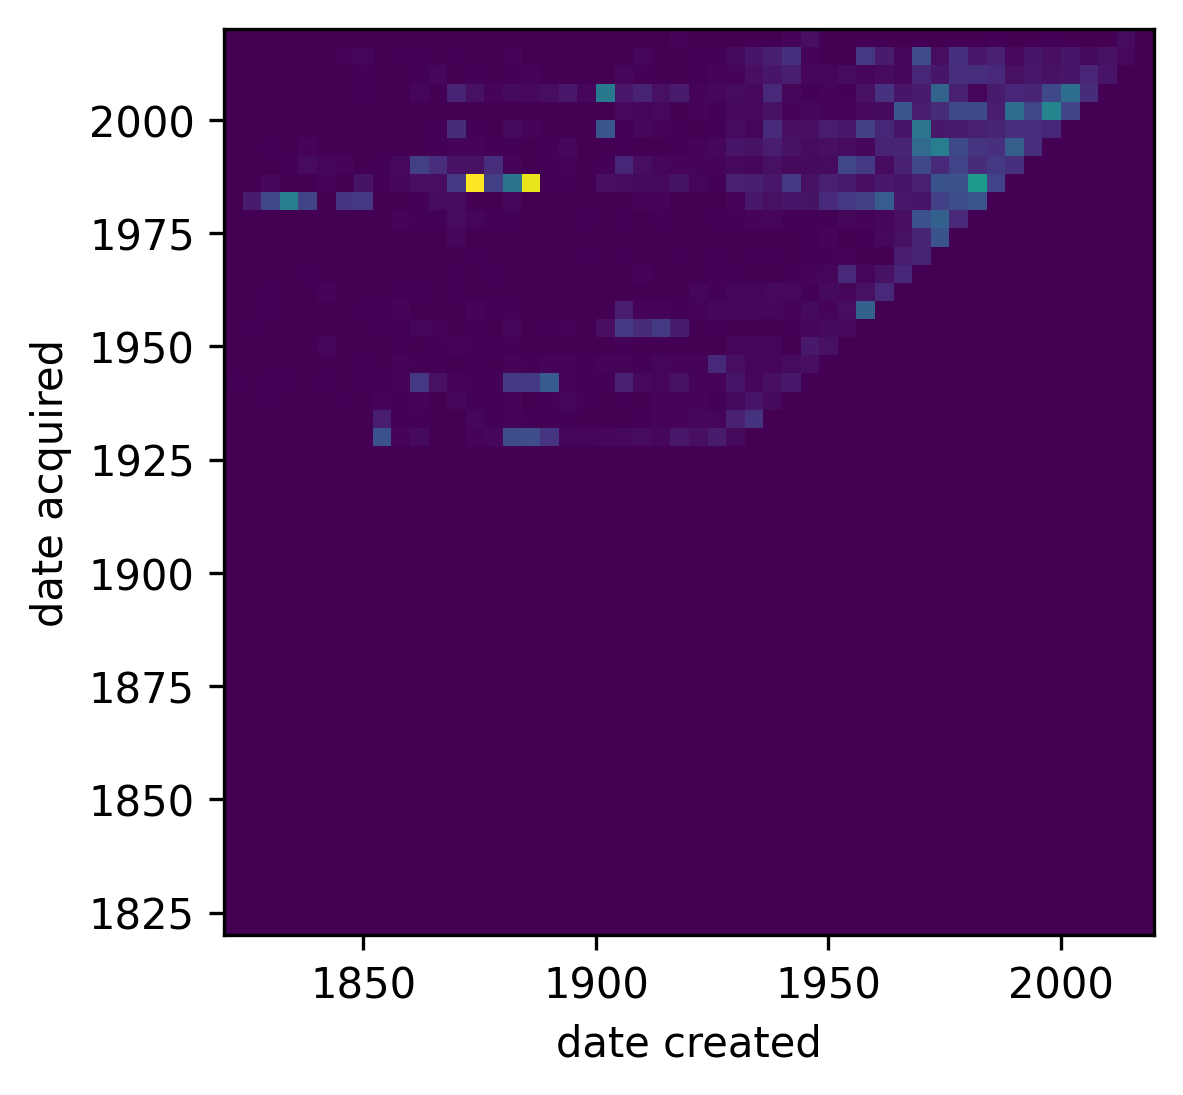
We can visualize the data with a 2d histogram:
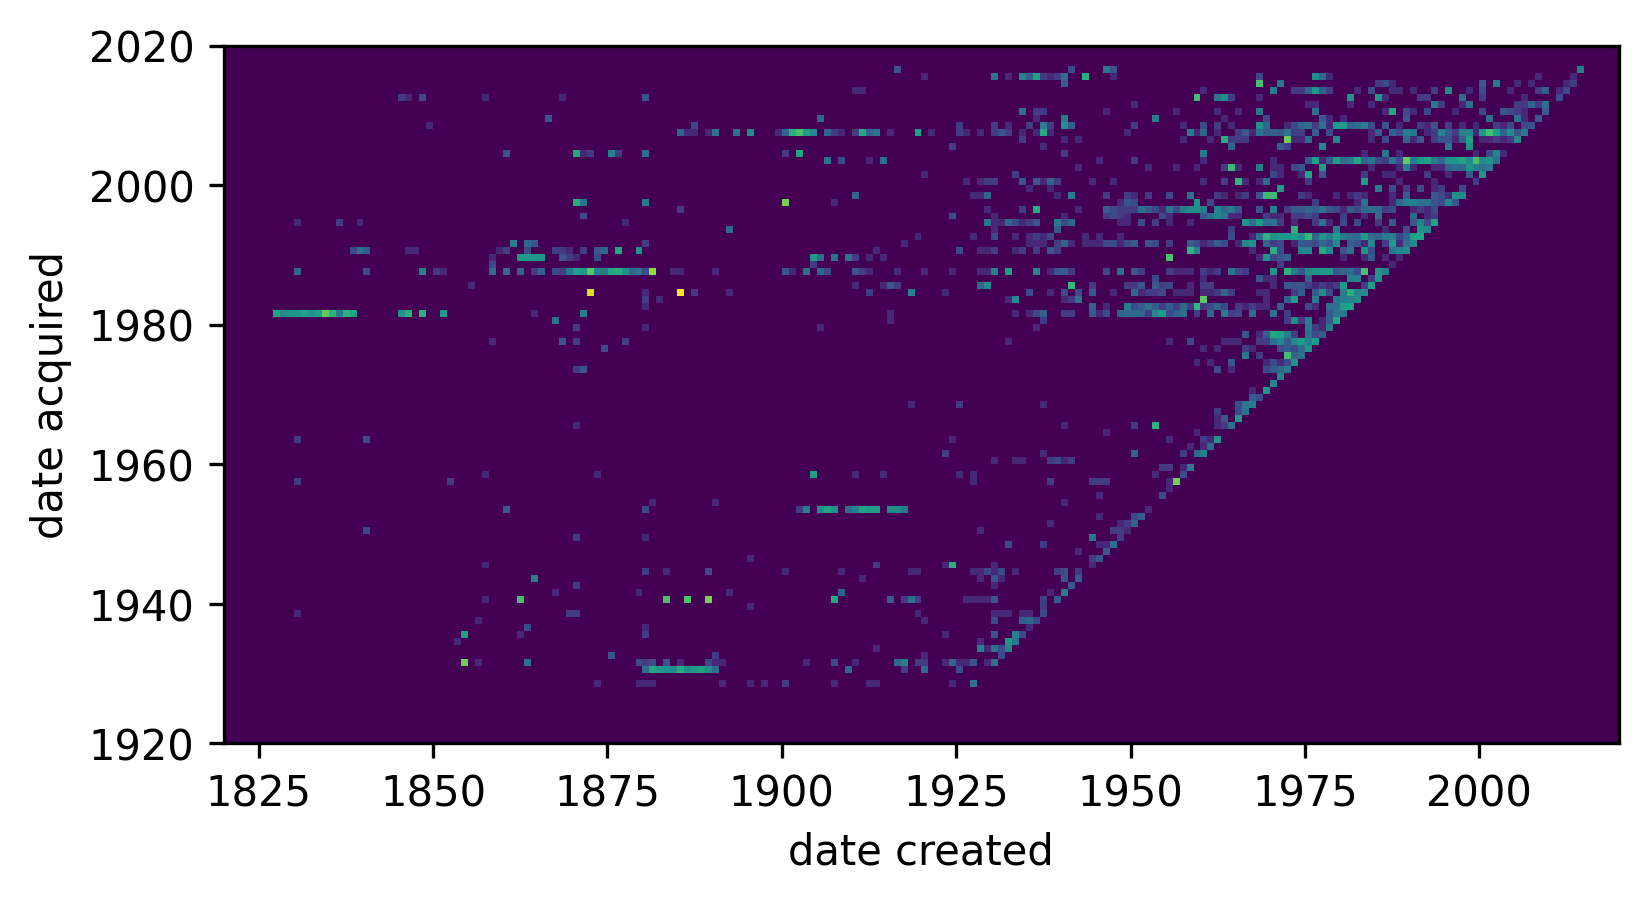
By binning manually, we can do more interesting things with the data:
For example, we can slice the data and visualize with a log scale:
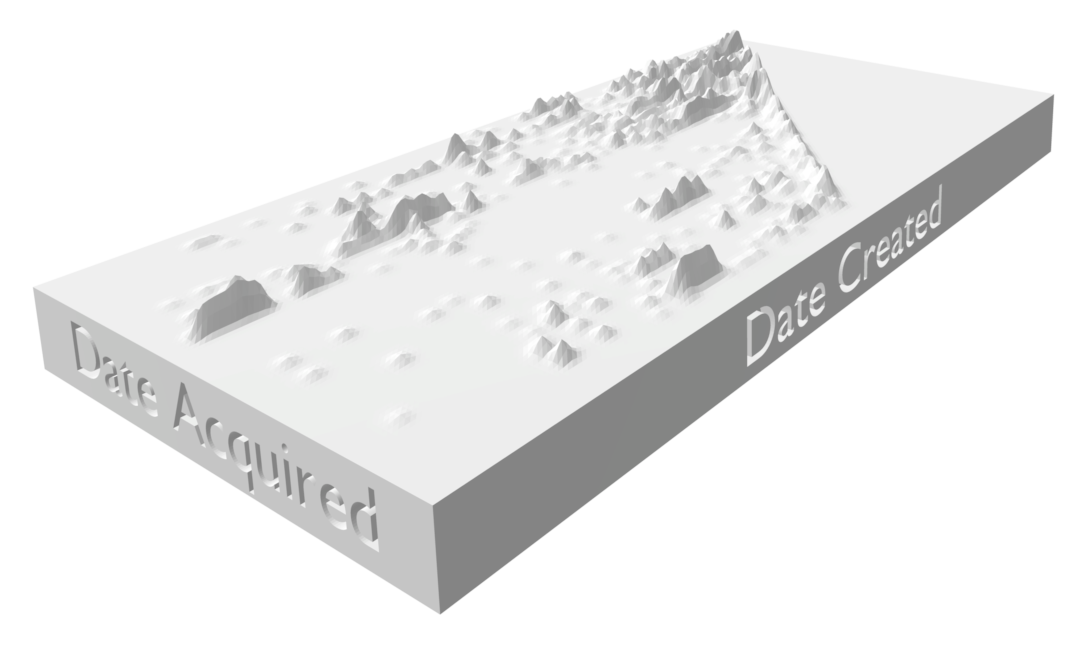
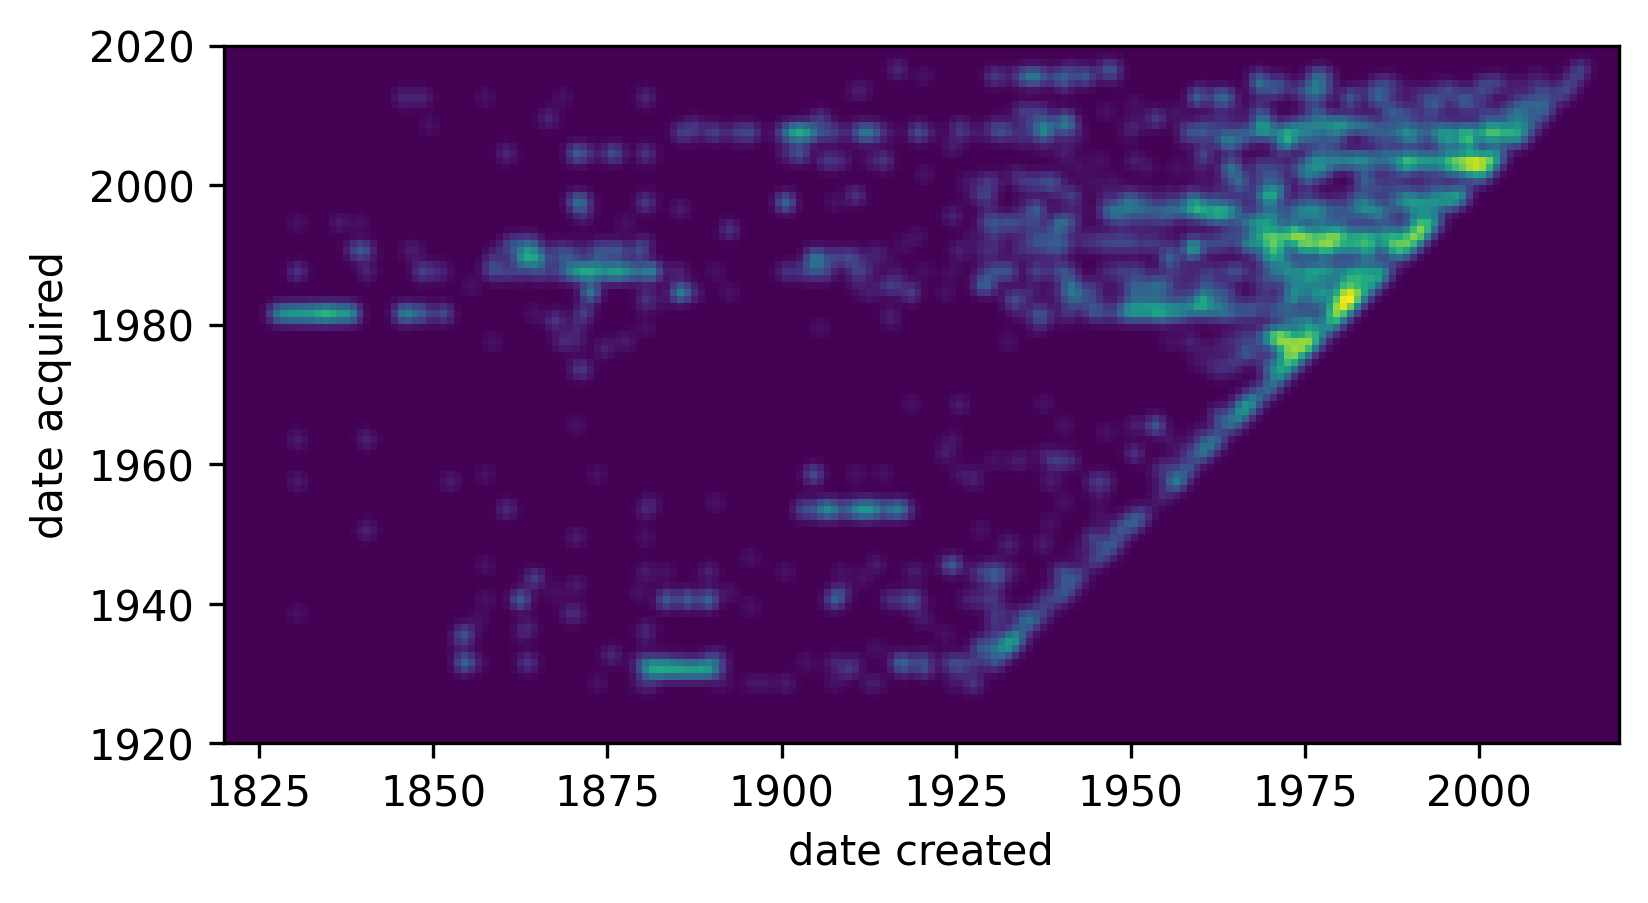
To visualize the data with something physical, we decided to 3D print the histogram. We first blurred the data because it would have been too jagged to 3D print otherwise:
We wrote a function that writes the data into a .obj file:
Adding some text in blender gives us the final model: